TORONTO, Sept. 19, 2016 /CNW/ - RNC Minerals' (TSX: RNX) (OTCQX: RNKLF) 68% owned subsidiary True North Nickel ("TNN") has discovered two new high grade gold mineralized zones at its Qiqavik Project in Northern Quebec. The new discoveries have extended the district-scale mineralized trend at Qiqavik to over 40 km, more than doubling the known extent of the trend. Prospecting in 2016 has resulted in the discovery of two new intrusion related high grade gold occurrences, the Aurora and Esperance zones, yielding multiple surface grab samples ranging from 5 to 189 g/t gold and up to 10% copper. Several outcropping areas, also containing high grade silver and zinc, represent a potentially important new discovery in an underexplored volcano-sedimentary belt within the Cape Smith Belt. These new discoveries follow-up on the success of the 2015 exploration program that outlined high grade gold mineralization with values up to 198 g/t in surface grab samples over a strike length of 15 km.
"These very positive prospecting results at Qiqavik extend the project to a mining district scale and give us confidence that this relatively unexplored region of Northern Quebec has the potential to host important new gold and copper deposits. TNN's advantageous land position in this emerging mineral belt has given it a unique opportunity to acquire some of the most prospective ground in the Cape Smith Belt for its new Qiqavik Project in one of the best mining jurisdictions in the world. Both Qiqavik and West Raglan could represent major discoveries in this underexplored, emerging polymetallic belt, which is comparable in scale to the Kambalda-Kalgoorlie camp of Western Australia, and home to the world class Raglan Mine. We intend to form a joint venture or spin out the Qiqavik property to fund future exploration programs through our TNN subsidiary with no dilution at the RNC level." said Mark Selby, President and CEO of RNC.
2016 Exploration Program
Prospecting and mapping data collected during the 2016 exploration program has outlined a number of possible intrusion- related mineral occurrences which could reflect the district-scale zoning of a very dynamic copper-gold-silver system.
The success of the short 10 day prospecting program in 2015 which discovered high grade gold mineralization up to 180 g/t resulted in the expansion of the Qiqavik property westward. Prospecting in this western extension of the property has been the main focus of 2016 exploration and has resulted in the discovery of two new intrusion related mineral occurrences, the Aurora and Esperance Zones, which have expanded the district scale mineralized trend to over 40km (Figure 1a&b and Table 1). Minor drilling of zones identified in the 2015 program has also been completed.
Aurora Zone
Gold mineralization at the Aurora Zone, situated about 20 km west of the Gerfaut discoveries made in 2015, occurs in smoky quartz veins up to 30 cm wide trending parallel to a granitic body (Figure 2). Some of these veins are zoned, with whitish quartz phases and various proportions of sulphides (trace to 8%). Sulphides include pyrite, pyrrhotite, chalcopyrite, galena, sphalerite and, more rarely, arsenopyrite. Visible gold was observed in two locations. No drilling has been completed on this target.
The granitic unit has been mapped over a strike length of 600 metres based on outcrops and subcrop boulders. Its maximum apparent surface thickness is 75 metres. Outcropping quartz veins are oriented parallel to the sill axis, and dip 45 to 75 degrees to the NNE. The granite is bounded by a basalt ridge to the south and by intermediate to felsic tuffs, sediments, and basalt to the north. Metasomatic fuchsite alteration occurs at the southern contact of the Aurora granite.
Twelve surface grab samples from quartz veins taken from different location within the sill graded from 5 g/t Au, up to 189 g/t Au. Assay results include grades of 67.8 g/t Au, 58.2 g/t Au, 58.1 g/t Au, 46.8 g/t Au, 34.8 g/t Au and 26.4 g/t Au. High gold grades were obtained over 200 metres of strike length (Figure 2). Two channel samples were taken over a continuous is 45cm interval across an outcropping quartz vein and into the altered granitic host rock. This interval returned 5.46 g/t over 0.45m including 30cm at 5.6 g/t Au and 15cm at 5.2g/t Au.
Esperance Zone
Gold and Copper mineralization at the Esperance Zone, situated about 10 km west of the Aurora discovery, is associated with a large mineralized shear zone trending ENE-WSW (Figure 3) hosting disseminated to massive sulphides. Mineralization occurs parallel to this trend for more than 500m and is associated with a large resistive body with moderate chargeability (Figure 3). This association is a very prospective target for future exploration programs. No drilling has been completed on this target.
Thirteen surface grab samples taken from different location within the mineralized shear zone graded from 4 g/t Au, up to 32 g/t Au. Assay results include grades of 31.9 g/t Au, 20.1 g/t Au, 21.7 g/t Au, 21.3 g/t Au, 18.7 g/t Au and 13.2 g/t Au. Significant copper results from the Esperance Zone include 10.3% Cu, 1.8% Cu, 1.7% Cu, 1.5 and 1.2% Cu (Figure 3).
Both the Esperance and Aurora discoveries were made through the implementation of real-time portable XRF analysis of tills during prospecting. Real-time arsenic anomalies indicated areas for focussed prospecting leading to the discoveries. Other indicator elements such as Sb and Bi that could not be measured in real-time may highlight additional targets once full analysis of pending till sample assays is complete.
Table 1: Significant1 Assay Results from Surface Grab Samples from 2016 Qiqavik Prospecting Program
|
Aurora Zone |
||||
|
Sample Number |
Sample Type |
Au (g/t) |
Ag (g/t) |
Cu % |
|
P137335 |
Subcrop |
189.00 |
51 |
0.02 |
|
P132943 |
Boulder |
67.80 |
36 |
0.03 |
|
P137336 |
Subcrop |
58.20 |
5 |
0.00 |
|
P137296 |
Boulder |
58.10 |
5 |
0.01 |
|
P137293 |
Subcrop |
46.80 |
6 |
0.00 |
|
P132942 |
Boulder |
34.80 |
45 |
0.02 |
|
P132961 |
Boulder |
26.40 |
19 |
0.00 |
|
P137294 |
Subcrop |
20.80 |
34 |
0.00 |
|
P132960 |
Subcrop |
12.55 |
46 |
0.00 |
|
P132946 |
Outcrop |
10.50 |
25 |
0.01 |
|
P137333 |
Outcrop |
5.58 |
4 |
0.01 |
|
P137334 |
Outcrop |
5.22 |
4 |
0.01 |
|
P132959 |
Subcrop |
2.95 |
26 |
0.00 |
|
P137817 |
Float |
2.93 |
2 |
0.01 |
|
P132944 |
Boulder |
2.72 |
20 |
0.01 |
|
P132947 |
Outcrop |
2.59 |
11 |
0.01 |
|
P132945 |
Boulder |
1.63 |
5 |
0.02 |
|
P132963 |
Subcrop |
1.20 |
2 |
0.00 |
|
Esperance Zone |
||||
|
Sample Number |
Sample Type |
Au (g/t) |
Ag (g/t) |
Cu % |
|
P137341 |
Boulder |
31.90 |
30.00 |
1.75 |
|
P137717 |
Boulder |
21.70 |
5.00 |
0.06 |
|
P137664 |
Boulder Field |
21.30 |
2.00 |
0.04 |
|
P137329 |
Subcrop |
20.10 |
4.00 |
0.34 |
|
P137665 |
Boulder Field |
18.65 |
4.00 |
0.02 |
|
P137706 |
Boulder |
13.20 |
7.00 |
1.71 |
|
P137687 |
Boulder |
12.65 |
17.00 |
1.48 |
|
P137330 |
Subcrop |
11.25 |
4.00 |
0.87 |
|
P137659 |
Boulder Field |
9.65 |
8.00 |
1.18 |
|
P137716 |
Boulder Field |
9.24 |
1.00 |
0.02 |
|
P137356 |
Boulder |
7.65 |
7.00 |
1.75 |
|
P137663 |
Boulder Field |
6.00 |
1.00 |
0.20 |
|
P137681 |
Outcrop |
4.18 |
2.00 |
0.08 |
|
P137671 |
Boulder Field |
3.66 |
3.00 |
0.12 |
|
P137339 |
Subcrop |
3.53 |
1.00 |
0.37 |
|
P137682 |
Outcrop |
2.88 |
2.00 |
0.38 |
|
P137666 |
Boulder Field |
2.56 |
9.00 |
0.93 |
|
P137707 |
Boulder |
2.50 |
33.00 |
10.25 |
|
P137660 |
Boulder Field |
2.18 |
0.50 |
0.07 |
|
P137670 |
Boulder Field |
2.03 |
0.50 |
0.13 |
|
P137677 |
Boulder |
2.01 |
2.00 |
0.24 |
|
P137678 |
Boulder Field |
1.37 |
6.00 |
0.62 |
|
P137719 |
Boulder |
1.37 |
1.00 |
0.19 |
|
P137342 |
Boulder |
1.28 |
9.00 |
0.89 |
|
P137694 |
Outcrop |
1.28 |
4.00 |
0.51 |
|
P137673 |
Boulder Field |
1.16 |
25.00 |
2.1 |
|
P137338 |
Boulder |
1.02 |
6.00 |
1.78 |
|
P132325 |
Outcrop |
1.02 |
1.00 |
0.59 |
|
P137289 |
Boulder |
0.12 |
8.00 |
1.42 |
|
P137655 |
Boulder Field |
0.12 |
5.00 |
1.01 |
|
P137602 |
Boulder |
0.09 |
6.00 |
1.83 |
|
Other Areas |
||||
|
Sample Number |
Sample Type |
Au (g/t) |
Ag (g/t) |
Cu % |
|
P132265 |
Boulder |
18.30 |
8.00 |
0.02 |
|
P137310 |
Boulder |
11.85 |
1.00 |
0.01 |
|
P132274 |
Boulder |
4.20 |
0.50 |
0.01 |
|
P137529 |
Boulder |
3.05 |
0.50 |
0.00 |
|
P132266 |
Boulder |
2.68 |
3.00 |
0.01 |
|
P137286 |
Outcrop |
1.77 |
0.50 |
0.01 |
|
P137274 |
Outcrop |
1.42 |
0.50 |
0.01 |
|
P137302 |
Outcrop |
0.34 |
34.00 |
0.58 |
|
1 Significant Results are those grab samples which returned values of: Au>1g/t, Ag>30g/t, Cu>1%). |
Gerfaut Zone
Drilling in 2016 was focused on the Gerfaut Zone in the eastern part of the Qiqavik Property (Figure 1) to test IP anomalies defined in the early stages of the 2016 program. Priority was given to anomalies coincident with mineralized boulders. In total 550m were drilled in 6 holes (Table 2). Due to drilling technical difficulties, only 55% of the planned 1000m of drilling was completed. Also, three of the six holes failed to reach target depth due to drilling technical difficulties leaving these targets untested.
Drilling returned several intervals grading greater than 1 g/t Au (Table 3). The source of the high-grade gold boulders in the Gerfaut Zone has not been identified; consequently this area remains prospective for future exploration. The most interesting drilling results were from hole QK-16-006 that was terminated at 56 metres before reaching target depth due to technical difficulties. This hole targeted a strong chargeability anomaly associated with a strong resistivity anomaly at 90 metres depth but intersected a zone of gold mineralization in the upper portion of the hole that yielded 1.17 g/t Au over 1.43m from 34.5 metres. This geophysical anomaly remains untested.
Table 2: Summary of 2016 Drilling
|
Hole Number |
Easting (Metres) |
Northing (Metres) |
Elevation (Metres) |
Azimuth (Degrees) |
Dip (Degrees) |
Depth (Metres) |
|
QK-16-001 |
6818337.3 |
447748.6 |
379.6 |
216.0 |
-50 |
68 |
|
QK-16-002 |
6825384.7 |
483615.5 |
432.2 |
346.6 |
-50 |
92 |
|
QK-16-003 |
6825354.4 |
483724.6 |
431.7 |
346.4 |
-50 |
35 |
|
QK-16-004 |
6825031.8 |
483589.5 |
439.8 |
168.5 |
-50 |
135 |
|
QK-16-005 |
6825513.9 |
485526.0 |
444.0 |
168.0 |
-50 |
164 |
|
QK-16-006 |
6826958.6 |
491046.8 |
426.8 |
167.0 |
-50 |
56 |
|
Total metres |
550 |
Table 3: Significant drill hole results
|
Hole Number |
From (Metres) |
To (Metres) |
Length (Metres) |
Au (g/t) |
|
QK-16-001 |
13.13 |
13.48 |
0.35 |
0.86 |
|
QK-16-001 |
27.60 |
28.16 |
0.56 |
1.68 |
|
QK-16-006 |
28.69 |
29.15 |
0.46 |
0.87 |
|
QK-16-006 |
34.50 |
35.93 |
1.43 |
1.17 |
About Qiqavik
The Qiqavik property is located in the Paleoproterozoic trans-Hudsonian orogen of northern Quebec, also known as the Cape Smith Belt (Figure 4) and consists of 592 claims covering 24,318 Ha. Gold and copper mineralization is hosted in metavolcanic and metasedimentary rocks of the Parent Group (Figure 5). The gold mineralization was initially discovered by Falconbridge while prospecting for nickel in the region. In 1996 Falconbridge drilled two holes, both of which encountered gold mineralization including 5.8 metres of 4.27 g/t gold in PAR96-012. Subsequent resampling of the drill core extended the mineralized interval in PAR96-01 to 10.5m of 3.08g/t Au which includes 1.1m of 5.45 g/t Au, 0.59%Zn and 3.4m of 6.79 g/t Au and 0.37% Zn3. Following a long period of inactivity, the core block of claims was picked up by Les Resources Tectonic Inc. ("Tectonic") in 2011. In 2012 the property was optioned to Corvus Gold Inc. who carried out a detailed soil/till survey and prospecting program which discovered mineralization over a strike length of 12km including several distinct surface geochemical anomalies.
|
2 Giovenazzo, D., 1997. Geological and Drill Report, Lac Parent P.E. 1103, Ungava. Falconbridge Exploration Ltd. Quebec assessment file GM 54904 |
|
3Jourdain, V., 1998. Rapport Sur Les Travaux D'Exploration de la Saison 1998. Quebec assessment file GM 561129 |
Qualified Person and Quality Assurance and Quality Control
The disclosure of the technical information contained in this news release has been approved by Alger St-Jean, P. Geo., Vice President Exploration of RNC, and a Qualified Person under NI 43-101.
The work program at Qiqavik was supervised by Michelle Sciortino, Senior Project Geologist who is responsible for all aspects of the work, including the quality control/quality assurance program. On-site personnel at the project log and weigh all samples prior to sealing and shipping. Sample shipments are sealed and shipped to ALS Chemex in Val d'Or, Quebec for analysis by ME-ICP61a for 33 elements (Four Acid Near Total - ICPAES Multi-element Intermediate Grade Method) and Au-ICP22 for gold (Fire Assay Fusion). Any samples which reported over 10g/t Au were analysed by method GRA22 (Fire Assay by Gravimetric Methods). Lab crusher and pulveriser were washed with blank material in between each sample. Preparation and assaying may be done in ALS facilities in Val d'Or, Sudbury or Vancouver. ALS Chemex's quality system complies with the requirements for the International Standards ISO 9001:2000 and ISO 17025:1999. Analytical accuracy and precision are monitored by the analysis of reagent blanks, reference material and replicate samples.
About RNC Minerals
RNC is a multi-asset mineral resource company focused primarily on the acquisition, exploration, evaluation and development of precious metal and base metal properties. RNC's principal assets are the producing Beta Hunt gold and nickel mine in Western Australia, the Dumont Nickel Project located in the established Abitibi mining camp in Quebec and a 30% stake in the producing Reed copper-gold mine in the Flin Flon-Snow Lake region of Manitoba, Canada. RNC also owns a majority interest in the West Raglan nickel project and Qiqavik gold project in Northern Quebec. RNC has a strong management team and Board with over 100 years of mining experience at Inco and Falconbridge. RNC's common shares trade on the TSX under the symbol RNX. RNC shares also trade on the OTCQX market under the symbol RNKLF.
Cautionary Statement Concerning Forward-Looking Statements
This news release contains "forward-looking information" including without limitation statements relating to the the liquidity and capital resources of RNC, production and cost guidance, the potential of the Beta Hunt and Reed mines, and the potential of the Dumont, West Raglan and Qiqavik projects.
Forward-looking statements involve known and unknown risks, uncertainties and other factors which may cause the actual results, performance or achievements of RNC to be materially different from any future results, performance or achievements expressed or implied by the forward-looking statements. Factors that could affect the outcome include, among others: failure of the parties to sign definitive agreements and satisfy conditions of closing; future prices and the supply of metals; the results of drilling; inability to raise the money necessary to incur the expenditures required to retain and advance the properties; environmental liabilities (known and unknown); general business, economic, competitive, political and social uncertainties; accidents, labour disputes and other risks of the mining industry; political instability, terrorism, insurrection or war; or delays in obtaining governmental approvals, projected cash costs, failure to obtain regulatory or shareholder approvals. For a more detailed discussion of such risks and other factors that could cause actual results to differ materially from those expressed or implied by such forward-looking statements, refer to RNC's filings with Canadian securities regulators available on SEDAR at www.sedar.com.
Although RNC has attempted to identify important factors that could cause actual actions, events or results to differ materially from those described in forward-looking statements, there may be other factors that cause actions, events or results to differ from those anticipated, estimated or intended. Forward-looking statements contained herein are made as of the date of this news release and RNC disclaims any obligation to update any forward-looking statements, whether as a result of new information, future events or results or otherwise, except as required by applicable securities laws.
SOURCE RNC Minerals
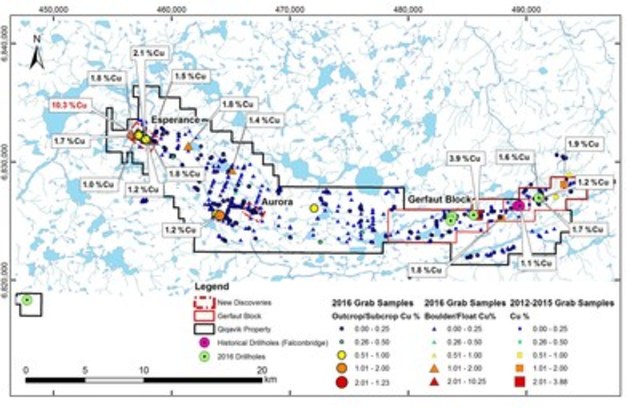
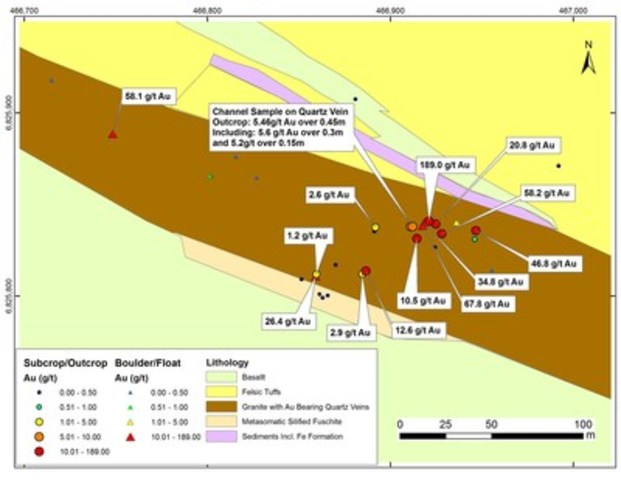
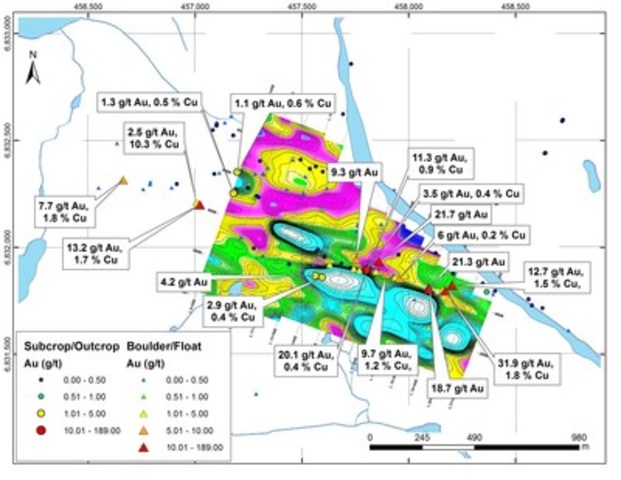
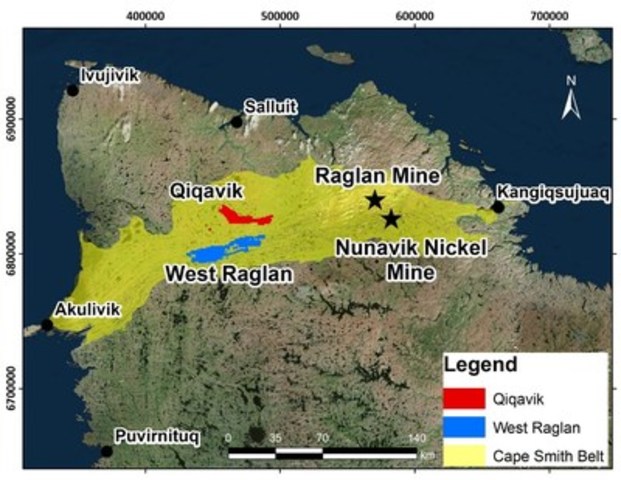
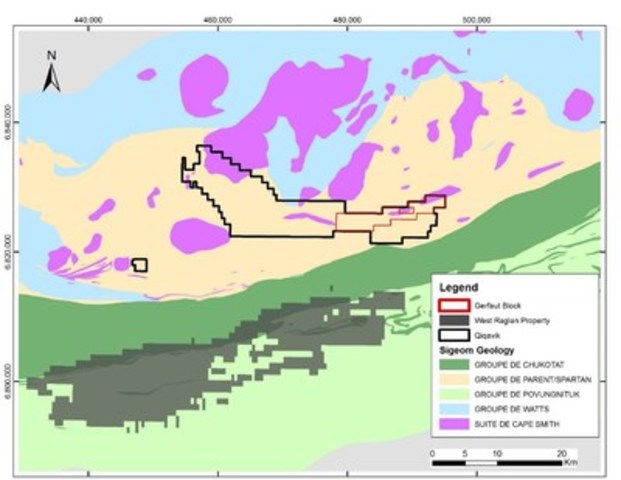
Image with caption: "Figure 1a: Map of Qiqavik Property Showing Significant Gold Exploration Results (CNW Group/RNC Minerals)". Image available at: http://photos.newswire.ca/images/download/20160916_C8278_PHOTO_EN_775566.jpg
Image with caption: "Figure 1b: Map of Qiqavik Property Showing Significant Copper Exploration Results (CNW Group/RNC Minerals)". Image available at: http://photos.newswire.ca/images/download/20160916_C8278_PHOTO_EN_775568.jpg
Image with caption: "Figure 2: Preliminary geological map of Aurora Zone discovery showing high grade Au mineralization extending over 200m (CNW Group/RNC Minerals)". Image available at: http://photos.newswire.ca/images/download/20160916_C8278_PHOTO_EN_775570.jpg
Image with caption: "Figure 3: Esperance grab sample Gold and Copper results shown on surface resistivity (Blue is high resistivity, pink is low) (CNW Group/RNC Minerals)". Image available at: http://photos.newswire.ca/images/download/20160916_C8278_PHOTO_EN_775572.jpg
Image with caption: "Figure 4 - Location of the Qiqavik Property in the Cape Smith Belt, Northern Quebec (CNW Group/RNC Minerals)". Image available at: http://photos.newswire.ca/images/download/20160916_C8278_PHOTO_EN_775574.jpg
Image with caption: "Figure 5 – Geology of the Cape Smith Belt showing Qiqavik and West Raglan Properties. (CNW Group/RNC Minerals)". Image available at: http://photos.newswire.ca/images/download/20160916_C8278_PHOTO_EN_775576.jpg

 EXPLO-ABITIBI AND CONSOREM TECHNOLOGY FOREM VAL-D’OR, QUÉBEC, MAY 30TH AND 31ST 2023
 THE SCIENCE OF MINERAL EXPLORATION GEOLOGICAL ASSOCIATION OF CANADA ANNUAL MEETING (GAC-MAC), L’ASSOCIATION GÉOLOGIQUE DU CANADA (GAC-MAC) SUDBURY, ONTARIO, 24 – 27 MAI 2023
 EXPLORATION GEOCHEMISTRY: BEYOND STATISTICS AND TOWARDS UNDERSTANDING
 Orford Announces New High Gold in Till Results and Targeting Update for Qiqavik 2020 Exploration Program
 GFG Outlines 5 Priority Targets from Regional Till Sampling Program at the Pen Gold Project Near Timmins, ON
 Integrity, Originality, Service